*this post has been gathering dust for the better part of a month so I figured I should send it on its way.
I’m more of a words person than a numbers person. Show me a graph and you’ve lost me. Explain it in words however, and I’m much more likely to understand. Right now I’m working on answering two questions in my research: which data analyses would be best and how to actually run them? Given that words are more my thing, I’ve decided to blog about figuring this out. What you’re in for with this post then, is a little bit about the process of research, how we go about answering these sorts of questions and some information about statistical techniques.
Decision making
Depending on your background, you may not have spent much time thinking about what researchers do with the data they collect. You may even be wondering why I don’t already know which analyses I will run or how to run them. Well, to use the ‘technical term,’ the number of number crunching techniques available to analyse my data is mind-boggling! Newbie researchers, tend to have a general understanding of a range of techniques but are most familiar with the handful of analyses they typically use. When you cast the net further to the statistical gurus and established researchers, the number of analyses they are familiar with increases exponentially. I’m definitely in the newbie researcher category. Looking into what other people have done and chatting to my supervisors has already highlighted a few techniques that might be better than those I’d planned to use originally and the need to refresh and familiarise myself with these techniques before diving in. So here goes…
Introductions
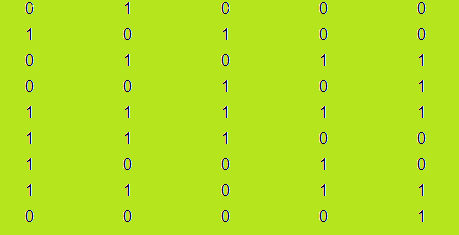
If this post is going to be at all intelligible you need to meet my data. I have dichotomous categorical data for two groups of participants. In English, this means that for each group, I have information about whether they’ve endorsed each item from various measures. Still with me? Good.
What I’m interested in is first, identifying for the items that are endorsed more by one of the groups and second, what these ‘good’ items might be tapping into. So in statistical terms, I need to work out the proportion of people who have endorsed each item and the inter-relationships between these items.
Investigating proportions: Discrimination indices vs. Chi-squares
Several analyses handle proportions well, including discrimination indices and chi-square analyses. Chances are, you haven’t heard of discrimination indices before, so I’ll start with those.
Discrimination indices represent proportional differences in item endorsement between groups. That is, a discrimination index would represent the proportion of people in Group A, subtracted from the proportion of people in Group B who voted yes rather than no for a particular item. We interpret these indices by looking at their size and polarity:
- Small indices suggest that the proportion of people who endorsed the item was comparable between groups, while large indices indicate one group endorsed the item more than the others.
- Positive indices tell us that group A endorsed the item more while negative indices tell us that group B endorsed the item more.
Here’s a worked example to make this clearer:
I have 10 participants in Group A and B. Each participant is asked ‘Do you like mint choc-chip ice cream?’ Eight people in Group A have very good taste and say ‘yes,’ but only three people in Group B say ‘yes’.
To calculate how good the mint choc chip question is in discriminating between the two groups I subtract the proportion of people who like this flavour in Group B (.30) from the proportion of people who like this flavour in Group A (.80) which gives me a discrimination index of .5.
The positive polarity of the index tells me that Group A endorsed the item more than group B, but does the score .5, mean this a good item? The general consensus in the literature (Gillis, Callahan & Romanczyk, 2011; Allison, Auyeung, & Baron-Cohen, 2012), is that good items have indices from .3 to .7. So, it seems that mint-choc chip ice cream preference is good at discriminating between Groups A and B.
But why is an index of .3 to .7 considered good? Do indices in this range reflect significantly different proportions? From what I can gather here: these indices were originally designed to evaluate ability based test items, and items falling above or below this range were judged to be too hard or too easy. So it doesn’t appear that this range has anything to do with statistically significant proportions. And, within the context of my research, this recommended range don’t have much meaning. So maybe chi-square analyses would be better for my study?
Chi-squares. If you’ve taken an introductory statistics course, you’ve probably heard of them. A quick refresher from (Pallant, 2009) reminds me that chi-square tests of independence allow you to determine whether the difference in proportions between groups on a categorical variable is significantly different and provides you with a phi-coefficient for effect size. In other words, chi-squares help us to work out how confident we can be that differences in proportions between two groups are not simply coincidental. Likewise, phi-coefficients help us to work out how big these group differences are so we can decide whether these differences have practical meaning. For example, if there was a significant difference in mint choc-chip preferences between groups, but the effect size was minuscule, ice cream preferences might not be the best way to discriminate between the two groups.
Investigating what the ‘good items’ are tapping into: Factor vs principal components analysis
Factor and principal components analyses look at the inter-relationships between variables so that they can be condensed into unique groups of variables (Pallant, 2009; Tabachnick & Fidell, 2007). These sorts of analyses are useful when trying to make sense of a larger construct e.g. ice-cream preferences and so we often use them to identify subscales within a test. For example a factor analysis of an ice cream preferences test might produce three factors that we could use to create sorbet, chocolate-based and fruit-based flavour subscales; the items that correspond to each factor are used to help work out what each factor represents.
But how do you decide whether to use a principal components analysis or a factor analysis? Generally, we use principle components analyses when there is no pre-existing rationale for how variables should inter-relate (Tabachnick & Fidell, 2007). In contrast, we use factor analyses when there is such a rationale for how the items should relate and we only want to take into account the shared rather than independent contributions of these items in explaining differences in the overall variable, i.e. ice cream preference (Tabachnick & Fidell, 2007). Yes, that last bit about shared contributions is still rather Greek to me too, so don’t quote me on that. Thankfully, for my study I think it’s pretty clear I need to use a principal components analysis.
Conclusions
The jury is still somewhat out on whether I should use discrimination indices or chi-squares and principal components or factor analyses. However, I think I have enough information now to ask the right questions to clear up the last few points I need to know to make this decision now.
References
Allison, C., Auyeung, B., & Baron-Cohen, S. (2012). Toward brief “red flags” for autism screening: The Short Autism Spectrum Quotient and the Short Quantitative Checklist in 1,000 cases and 3,000 controls. Journal of the American Academy of Child & Adolescent Psychiatry, 51(2), 202-212.
Gillis, J. M., Callahan, E. H., & Romanczyk, R. G. (2011). Assessment of social behavior in children with autism: The development of the Behavioral Assessment of Social Interactions in Young Children. Research in Autism Spectrum Disorders, 5(1), 351-360. doi: 10.1016/j.rasd.2010.04.019
Pallant, J.(2009). SPSS Survival Manual: a step by step guide to data analysis using SPSS (3rd ed.). Crows Nest, NSW: Allen & Unwin.
Tabachnick, B. G., and Fidell, L. S. (2007). Using Multivariate Statistics, 5th ed. Boston : Pearson Education, Inc. / Allyn and Bacon.